







 WhatsApp
 Assessment
Leadership Insight:
360° Leadership Assessment
-
How well do your leaders truly understand themselves?
-
Are you aware of the blind spots your managers may not recognize?
-
Can you measure the ROI of your leadership development investments?
-
How satisfied are team members with their managers?
-
Are your leaders’ strengths being fully leveraged?
-
Do you have reliable leadership data for succession planning?
61%
61% of leaders misjudge their own performance. (Zenger Folkman)
30%
30% of leaders have a career-limiting flaw they are unaware of. (Zenger Folkman)
$1.2M–$4.5M
Weak leadership results in $1.2M loss per department, while strong leadership generates $4.5M revenue per department. (Zenger Folkman)
-
 20–30 minutes per person + 2–4 weeks collection period
-
 80–120 questions (based on the competency model)
-
 8–10 people (manager, subordinate, peer level)
-
 Leadership Insight
 Managing Without Data
 Managing with 360°
Self-Awareness
Only 4% alignment between leaders’ self-evaluation and external perception
Accuracy doubles with multiple perspectives
Blind Spots
30% have a critical flaw they are unaware of
Blind spots are identified before major mistakes occur
Employee Engagement
Under poor leadership, engagement drops to 11%
With strong leadership, engagement rises to 57%
Financial Impact
Weak leadership causes $1.2M loss per department
Strong leadership generates $4.5M contribution per department
Strength Utilization
Strengths remain undiscovered (34th percentile)
3 strengths → 81st percentile (Top 20%)
Development Timing
First real leadership training at age 42 on average (~10 years delay)
Early diagnosis enables faster development interventions
What Is a 360° Leadership Assessment?
A 360° Leadership Assessment is a comprehensive feedback system that evaluates a leader’s competencies from multiple perspectives, including manager, direct reports, peers, and self-assessment.
Unlike single-source evaluations, the 360° methodology combines multiple data sources to reveal a leader’s true performance profile.
Based on over 1.6 million assessments and more than 30 years of research, this methodology is widely recognized as a gold standard for leadership development and is used by more than 2,500 organizations worldwide.



“360° feedback allows leaders to look into the mirror—but this mirror reflects a true image formed by the perspectives of all stakeholders, not just one. Leaders who rate themselves modestly are perceived as twice as effective.”

Self Evaluation
How leaders perceive themselves, their strengths, and development areas
Manager Evaluation
Senior leadership’s view on strategic thinking, decision-making, and organizational contribution
Peers Evaluation
Colleagues’ observations on collaboration, communication, and team dynamics
Direct Report Evaluation
Team members’ experiences regarding coaching, motivation, and leadership style
Customer Voice
“The 360° assessment revealed how our managers were actually perceived by their teams. The gap between self-evaluation and direct-report feedback was shocking. Thanks to this awareness, we launched a targeted coaching program, and within 12 months team engagement increased by 40%.”
CHRO
Technology Sector
360° Leadership Assessment — Product Overview
360° Leadership Assessment
Product Name
Leadership Insight (ASS)
Category
SP
Partner
LEC (Primary) | STRG | LERG | GROC | PERC | INHR
Challenge
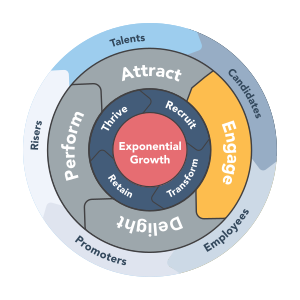
ENG (Engage)
Flywheel
LEA (Leaders)
Target Audience
~80–120 questions (depending on the competency model)
Number of Questions
8–10 people (manager, direct reports, peers)
Minimum Evaluators
4 Perspectives: Self + Manager + Peers + Direct Reports
Methodology
Online Platform
Implementation Method
Turkish, English
Language Options
1.6M+ assessments, 122K+ leaders
Benchmark
Competency model, industry, organizational structure
Customization
Assessment + Report + 1:1 Coaching
Package Scope
Project Manager
Included
Executive Coaching, Team Report, Action Planning
Optional Services
Statistics for Sales and Marketing Use
 Self-Awareness Statistics
61% of leaders misjudge their own performance (Zenger Folkman)
Only 4% alignment between self-assessment and external perception (Mabe & West)
Only 9% of leaders demonstrate strong self-awareness (Hay Group)
Leaders who truly know themselves show 36% higher performance (Cornell)
30% of leaders have a career-threatening flaw they are unaware of
Show More
Financial Impact Statistics
Weak leadership leads to an average $1.2M loss per department (Zenger Folkman)
Strong leadership generates $4.5M revenue per department (Zenger Folkman)
The top 10% of leaders produce 2× higher net profit
50% lower turnover
70% higher employee engagement
40% increase in customer satisfaction
Show More
Strengths Paradigm
57% 0 strengths → 34th percentile
1 strength (90th percentile) → 64th percentile
3 strengths → 81st percentile (Top 20%)
100% of “great” leaders possess multiple strengths
100% of “weak” leaders have 2+ critical flaws
Show More
Feedback & Timing
57% of employees prefer corrective feedback
64% want more feedback
The first leadership training occurs at age 42 on average (~10-year delay)
The bottom 10% in requesting feedback are also the least effective leaders
The best leaders seek feedback from more people and more frequently
Show More
Data Sources
1.6M+ 360° assessments
122,000+ global leaders
20M+ data points
750,000+ evaluators
2,500+ organizations
30+ years of research
Meta-analyses: Mabe & West (1982), Conway & Huffcutt (1997)
AI Literacy Score™
Show More
Related Success Programme Solutions
 Related Assessment
DiSC 363 for Leaders
RMP Motivation Insight
Cognitive Insight (Hogan, Saville)
Leadership Style Assessment
Team Effectiveness Assessment
 Related Training & Consulting
Executive Coaching (COA)
Leadership Development Program (PTP)
Crucial Conversations (PTP)
Team Building Consulting (CON)
Leadership Pipeline Consulting (CON)